
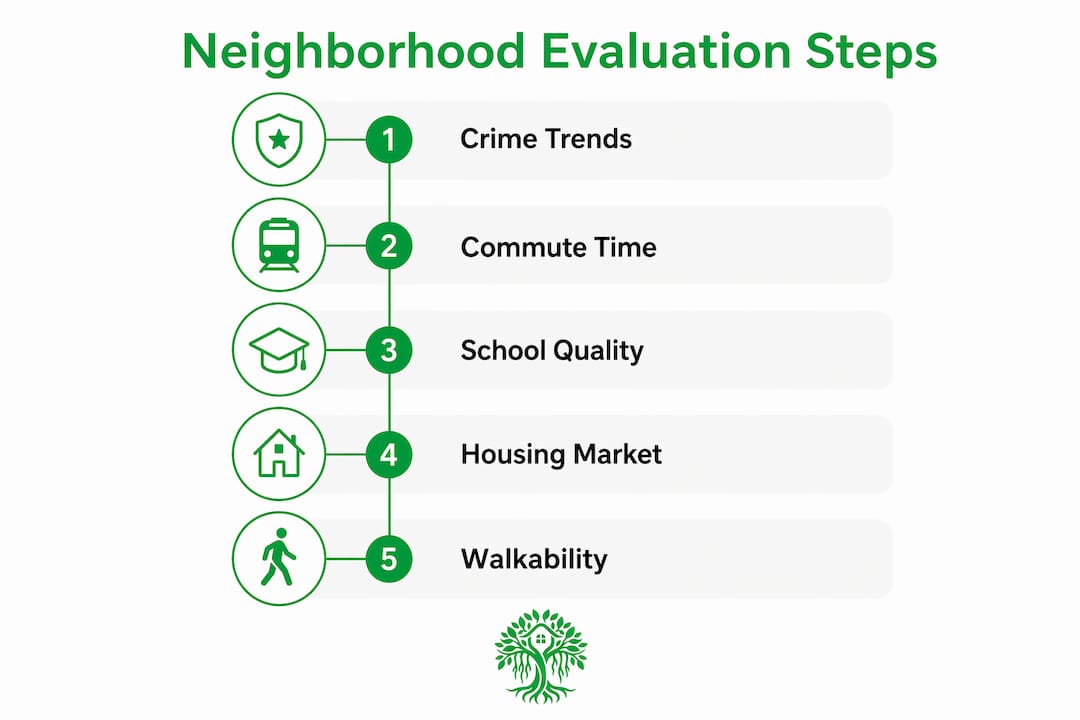
A neighborhood is a good place to live when its crime trend is falling, your commute is under 30 minutes, schools meet your household’s needs, and housing costs fit your true budget including insurance and taxes. Run this quick check before you go deeper:
- Crime trend: Pull the last 3 years of data from your local police department portal or FBI crime statistics. A falling trend matters more than a single year’s count.
- Commute reliability: Test your actual route at your actual departure time, not Google Maps at noon on a Sunday.
- Grocery and healthcare access: Can you reach both within 15 minutes without a car?
- School quality: Check the district’s state report card and GreatSchools ratings if there are children in your household.
- Flood and wildfire flags: Run the address on FEMA’s Flood Map Service Center before you go further.
If all five pass, keep going. If two or more fail, look at comparable listings one ZIP code over before committing.
Table of Contents
- What objective metrics actually tell you about a neighborhood
- Where to find reliable data on any neighborhood
- How to evaluate a neighborhood in one weekend
- Costs and timeline that change based on which neighborhood you choose
- Red flags that should give you pause, and trade-offs worth accepting
- A sample decision matrix: turning your scores into a clear answer
- How Ficustree helps you apply this method faster
- Key Takeaways
- One habit every first-time buyer should build
- Ficustree puts this method to work for you
- Authoritative sources and tools to bookmark
- FAQ
What objective metrics actually tell you about a neighborhood
The best neighborhoods to live in share a pattern: their key metrics trend in the right direction over time, not just at a single snapshot. Here is what to measure and what “good” looks like for each.
Multi-year crime trend. A neighborhood with a sustained decline in property crimes over several years is meaningfully safer than one with a flat or rising count, even if the raw number looks low today. Single-year snapshots routinely mislead buyers. Pull at least three years from your local PD portal or the FBI’s Uniform Crime Report.

Commute time and transit options. For most buyers, a median commute under a moderate time each way is the threshold where daily stress stays manageable. Remote workers should still check transit scores; hybrid schedules change, and resale value tracks transit access closely.
School-district performance. State report cards and GreatSchools percentile rankings give you a fast read. For families, a district trending upward on proficiency scores matters more than a single year’s rank.
Housing price trends and inventory. A neighborhood where median prices have risen steadily and days-on-market are short signals demand. Thin inventory also means you will likely face competition, which affects your timeline and offer strategy.
Walkability and daily amenities. Walk Score rates addresses on a 0–100 scale based on proximity to groceries, pharmacies, parks, and restaurants. A score above 70 typically means you can handle most errands without a car.

Natural-hazard exposure. FEMA flood zone designations directly affect insurance premiums. Wildfire risk maps from CAL FIRE (for California buyers) or the Texas A&M Forest Service add another layer. Marketing materials and listings rarely surface environmental hazards like Superfund proximity, high-voltage transmission lines, or flight-path noise overlays, so you have to check these yourself.
Demographic and lifestyle fit. Census/ACS data shows median age, household composition, income distribution, and commute modes. None of these are dealbreakers on their own, but a neighborhood where the lifestyle pattern matches your weekly routine predicts long-term satisfaction better than any single amenity.
For first-time buyers: weight crime trend, commute, and true housing cost first. For families, add school district. For remote workers, swap commute for walkability and internet infrastructure.
Where to find reliable data on any neighborhood
A complete neighborhood picture requires both national public datasets and local sources. Here is the short toolkit:
- Census/ACS (census.gov): Demographics, income, commute modes, and housing tenure. Use the American Community Survey 5-year estimates for the most stable figures. Note that ACS data carries margins of error, especially in small geographies.
- FBI UCR / local PD portals: Crime counts and trends by offense type. The FBI’s national data runs 12–18 months behind; your local police department’s online crime map is usually more current.
- FEMA Flood Map Service Center (msc.fema.gov): Flood zone designation by address. Zone AE or VE means mandatory flood insurance, which adds meaningfully to your monthly cost.
- GreatSchools (greatschools.org) and Niche (niche.com): School ratings, test scores, and parent reviews. Cross-reference with the state’s official report card for the most accurate proficiency data.
- Walk Score (walkscore.com): Walkability, transit, and bike scores by address. A 5-minute check that surfaces transit gaps you would not notice from a listing photo.
- Zillow and Redfin: Median sale price trends, days on market, and price-cut frequency by ZIP code. Use the 12-month trend view, not the current listing price alone.
- County assessor website: Property tax history, assessed value, and parcel details. Tax rates vary significantly by county and can shift your monthly payment by hundreds of dollars.
- Local planning and zoning portals: Pending rezoning, approved developments, and infrastructure projects. A planned highway expansion or new transit line can change a neighborhood’s character within your ownership window.
Pro Tip: Use the AI home search tools available to first-time buyers to pull several of these layers into one view, rather than toggling between eight browser tabs.
How to evaluate a neighborhood in one weekend
This method takes 48–72 hours and produces a confident yes/no answer. Follow the steps in order.
-
Friday evening: run the data check. Pull crime trend, FEMA zone, school rating, Walk Score, and 12-month price trend for the target address. Flag any metric that falls below your threshold. Budget 60–90 minutes.
-
Saturday morning (7–9 AM): the commute visit. Drive or take transit your actual route at your actual departure time. Note congestion, parking availability near the home, and school-zone traffic if relevant. This is the first leg of the Multi-Visit Test: weekday morning reveals commute and school-flow realities that a weekend afternoon hides entirely.
-
Saturday afternoon: the walkability walk. Park and walk a 10-minute radius. Check grocery stores, pharmacies, coffee shops, and parks. Note business vacancy rates; a block with multiple empty storefronts is a signal worth investigating.
-
Saturday evening (8–10 PM): the noise and nightlife check. Return after dark. Assess street lighting, foot traffic, noise levels, and how comfortable you feel. This visit catches bar-district noise, parking overflow, and lighting gaps that daytime visits miss.
-
Sunday: the bad-weather or off-peak check. If rain is forecast, use it. Drainage problems, flooded gutters, and standing water in driveways reveal maintenance and infrastructure quality that no listing photo will show.
-
Talk to two or three residents. Ask what they wish they had known before moving in. Dog walkers, people gardening, and parents at a nearby park are the easiest to approach.
-
Build your decision matrix. Score each metric from 1–5 against your personal weights (see Section 7 for the template). A total score above 350 out of 500 (70% of the maximum) signals a strong fit; above 400 is a strong match. Below 250 means look elsewhere.
Pro Tip: Before you weight lifestyle amenities like a rooftop gym or wine bar nearby, audit your actual two-year behavior. If you have not used a gym in two years, deprioritize gym proximity versus grocery access or commute time. Buying for who you are, not who you plan to become, reduces buyer regret.
Costs and timeline that change based on which neighborhood you choose
Neighborhood choice is not just a lifestyle decision. It directly affects your monthly budget and how long the purchase takes.
- Commute costs: A 30-mile round-trip daily commute in a gas-powered vehicle costs roughly $200–$400 per month depending on fuel prices and vehicle efficiency. Transit passes in major California metros run $100–$200 per month. These are real line items in your post-purchase budget.
- Flood and fire insurance: A home in FEMA Zone AE can require flood insurance that adds $1,000–$3,000 per year to your carrying cost. High wildfire-risk designations in California have pushed some insurers out of the market entirely, making coverage harder to find and more expensive.
- Property taxes: Rates vary by county and city. In California, Proposition 13 caps the assessed value increase annually, but the base rate differs by county. In Texas, effective property tax rates are among the highest in the country, with varying percentages of assessed value annually.
- HOA fees: Neighborhoods with homeowners associations add monthly fees that range from under $100 to over $500 depending on amenities and maintenance scope. Always request the HOA’s reserve fund study before making an offer.
- Timeline impact: A neighborhood with low inventory and high demand typically compresses your decision window. Expect to move faster on offers, which means your data check and site visits need to happen before you fall in love with a specific listing, not after.
Red flags that should give you pause, and trade-offs worth accepting
Not every imperfect metric is a dealbreaker. Knowing the difference saves you from both bad purchases and missed opportunities.
Red flags worth pausing for:
- A rising crime trend over two or more consecutive years, especially for violent crime
- Repeated FEMA flood claims on the property or adjacent parcels
- Persistent housing abandonment or high vacancy rates on the block
- Severe peak-hour congestion that adds 45+ minutes each way to your commute
- A materially underperforming school district when children are in your household
- Environmental hazards like Superfund proximity or flight-path noise overlays that do not appear in listing descriptions
Trade-offs that are often reasonable:
- A smaller home footprint in exchange for a 15-minute commute versus a 45-minute one
- Higher ambient noise in a walkable urban neighborhood versus a quiet suburb with car dependency
- A slightly lower school rating in a district with a clear upward trend
Before making an offer when a red flag is present, get answers to three questions: Can you get insurance at a reasonable premium? Is there a funded infrastructure project that addresses the issue? And does the seller’s disclosure confirm or contradict what you found in public data?
A sample decision matrix: turning your scores into a clear answer
Use this template to compare two neighborhoods on the metrics that matter most to you. Assign a weight (total weights must sum to 100) and a score from 1–5 for each metric, then multiply.
| Metric | Weight | Neighborhood A Score | Neighborhood A Weighted | Neighborhood B Score | Neighborhood B Weighted |
|---|---|---|---|---|---|
| Crime trend (3-year) | — | 4 | 100 | 2 | 50 |
| Commute time/reliability | — | 3 | 60 | 5 | 100 |
| School district quality | — | 5 | 100 | 3 | 60 |
| Housing cost vs. budget | 15 | 3 | 45 | 4 | 60 |
| Walkability/amenities | 10 | 4 | 40 | 5 | 50 |
| Hazard/insurance risk | 10 | 5 | 50 | 3 | 30 |
| Total | 100 | 395 | 350 |
In this example, Neighborhood A scores 395 out of 500 and Neighborhood B scores 350. A score above 350 (70% of 500) signals a workable fit; above 400 is a strong match. Neighborhood A wins on safety and schools; Neighborhood B wins on commute and walkability. The matrix makes that trade-off visible rather than leaving it as a gut feeling.
A five-category scoring framework covering housing cost, commute and mobility, daily convenience, home fit, and future flexibility is a practical starting structure. Adjust the weights to reflect your actual priorities, not a generic template.
How Ficustree helps you apply this method faster
Ficustree is built specifically for first-time buyers who want data-driven guidance without spending weeks assembling it themselves. Here is how the platform maps to the method above:
- Neighborhood insights layer: Ficustree pulls public data (crime trends, school ratings, walkability, hazard flags) into plain-English summaries that explain why a neighborhood fits your specific profile, not just a raw score. This is the AI-powered approach that converts dashboard noise into a clear narrative.
- Affordability calculator: Factor in property taxes, HOA, insurance, and commute costs alongside the mortgage payment to see your true monthly number before you fall for a listing.
- On-demand showing agents: Book an agent by the hour for your Saturday morning commute visit or your Sunday walkthrough. No full-time agent relationship required until you are ready.
- Decision intelligence: The platform’s scoring adapts to your weights, so the same neighborhood ranks differently for a family prioritizing schools versus a remote worker prioritizing walkability.
- Buyer representation: Ficustree represents you directly. You pay $1,000 at closing plus 1% commission and keep a rebate of roughly 2% where legally permitted.
The goal is to compress what typically takes six months of confusion into two months of clarity, with every data layer you need already assembled.
Key Takeaways
A neighborhood is a good fit when its crime trend is falling, commute is manageable, schools meet your needs, and the true all-in cost fits your budget.
| Point | Details |
|---|---|
| Trend beats snapshot | Check crime data over 3 years, not just the most recent year’s count. |
| True cost includes more | Factor in commute, flood/fire insurance, property taxes, and HOA before deciding. |
| Multi-Visit Test | Visit at weekday morning, weekend evening, and during bad weather to see the full picture. |
| Decision matrix | Score each metric against your personal weights; a score above 350 out of 500 (70% of the maximum) signals a strong fit. |
| Ficustree | Ficustree’s AI decision layer assembles neighborhood data, affordability numbers, and on-demand agents so first-time buyers reach a clear yes/no faster. |
One habit every first-time buyer should build
Most buyers I talk to have spent months scrolling listings and almost no time auditing their own routine. Before you weight any amenity, write down what you actually did last Tuesday and last Saturday. Where did you go? How did you get there? What would have been harder with a 40-minute commute added each way? That two-minute exercise surfaces your real non-negotiables faster than any checklist. The buyers who regret their neighborhood choice almost always picked for the life they intended to live, not the one they actually live. Build the habit of separating those two things early, and the decision matrix becomes much easier to fill in honestly.
Ficustree puts this method to work for you
First-time buyers in California and Texas now have a faster path from “is this neighborhood a good place to live?” to a confident offer. Ficustree is not a listings site. It is the decision intelligence layer that assembles crime trends, school ratings, hazard maps, and affordability numbers into a clear picture of whether a specific address fits your life.

You get on-demand showing agents for your site visits, a platform that adapts its neighborhood scoring to your actual priorities, and direct buyer representation at $1,000 plus 1% at closing, with a rebate of roughly 2% where permitted. No six-month confusion spiral. Start your neighborhood search on Ficustree and see your personalized fit score before your next weekend visit.
Authoritative sources and tools to bookmark
- FBI Crime Data Explorer: National crime statistics by offense type and jurisdiction; best for multi-year trend analysis.
- BestNeighborhood.org: Aggregated neighborhood quality scores across U.S. cities; useful for a fast initial screen.
- FEMA Flood Map Service Center: Official flood zone designations by address; required before any purchase in a coastal or low-lying area.
- GreatSchools (greatschools.org): School ratings and parent reviews; cross-reference with your state’s official report card.
- Walk Score (walkscore.com): Walkability, transit, and bike scores by address; free and instant.
- Zillow and Redfin: Median price trends, days on market, and inventory levels by ZIP code.
- County assessor website: Property tax history and assessed value; search “[county name] assessor” to find your local portal.
- Local planning and zoning portal: Pending developments and rezoning decisions; search “[city name] planning department” or “[city name] zoning map.”
- Census/ACS (data.census.gov): Demographics, income, and commute data; use 5-year ACS estimates for small geographies.
FAQ
How do you check if a neighborhood is safe?
Pull at least three years of crime data from your local police department’s online portal or the FBI’s crime statistics and look for a falling trend, not just a low single-year count. A declining trend over multiple years is a stronger safety signal than any one year’s number.
How can you tell if a neighborhood is a good fit before moving in?
Use the Multi-Visit Test: visit at weekday morning, weekend evening, and during bad weather to observe commute flow, noise levels, and drainage. Combine those observations with a scored decision matrix weighted to your personal priorities.
How do you look up whether a neighborhood is safe?
Check your local police department’s crime map for current data, then cross-reference with the FBI Uniform Crime Report for multi-year trends. FEMA’s Flood Map Service Center and your state’s environmental agency add hazard-risk context that crime data alone does not cover.
Is it better to live in a neighborhood with strong walkability?
Walkability reduces car dependency and tends to support stronger long-term property values, but the right answer depends on your routine. A Walk Score above 70 is a meaningful threshold for buyers who want to handle daily errands without driving.
How does Ficustree help evaluate a neighborhood?
Ficustree’s AI decision layer pulls crime trends, school ratings, walkability scores, and hazard flags into plain-English summaries tailored to your priorities, so you can reach a clear yes/no on a neighborhood without assembling eight data sources yourself.
Recommended
- Best San Diego Neighborhoods for Buyers in 2026 – ficustree.ai
- Top 3 Condo vs Townhouse First Time Buyer Alternatives 2026 – ficustree.ai
- Buying a Home in California: Browse 467 Cities
- Bay Area Home Buying: A Practical Guide for Buyers

Leave a Reply