
Yes. That is a wide band on purpose. A district’s effect on price depends on how “good” gets measured (test scores, spending, or growth metrics), how tight the local housing supply is, and whether the area allows open enrollment or school choice, which loosens the tie between address and school assignment. If you’re pricing a home partly on its school zone, treat that range as a starting point, not a formula.
Key Takeaways
School district quality changes home value in a measurable, verifiable way, but the size of the effect depends on which measure, boundary, and market you’re actually looking at.
| Point | Details |
|---|---|
| Premiums vary widely | Expect a range of 3% to 21% depending on district tier, study design, and local supply constraints. |
| Distance matters more for elementary | Elementary proximity carries roughly a 7.29% per-kilometer effect versus 1.43% for high schools. |
| Spending signals get priced in | Teacher salary spending shows the clearest capitalization link, per NBER’s school finance analysis. |
| Verify before you trust a claim | Confirm attendance boundaries directly with the district, since listing descriptions can be outdated or wrong. |
| Ficustree can run the checks for you | Ficustree’s platform surfaces boundary data and comparable sales so buyers can price school premiums before bidding. |
Table of Contents
- Does School District Impact Home Value? The Numbers Buyers Search For
- How School Quality Actually Gets Baked Into Price
- What Premium Should You Actually Expect By School Rating?
- A Step-by-Step Way to Price School Quality Into Your Offer
- Which Studies Should You Actually Trust?
- How We Read School-Price Data When Advising Buyers
- Let Ficustree Check the School Premium Before You Bid
- Where to Verify School and Boundary Data Yourself
- Sources
- FAQ
Does School District Impact Home Value? The Numbers Buyers Search For
The short answer to “does school district impact home value” is yes, and the effect shows up in three distinct ways: a price premium, a distance penalty, and a liquidity boost. Here’s what the data actually says.
- Premium range: Homes zoned to top-rated schools carry price premiums of 3% to 21% over similar homes in average or below-average districts, with the higher end typically found in supply-constrained metros.
- Distance penalty, elementary schools: Home values drop roughly 7.29% for every additional kilometer a house sits from its nearest elementary school.
- Distance penalty, high schools: The same study found a much gentler 1.43% drop per kilometer from the nearest high school, since teenagers commute independently and families weigh proximity less heavily.
- Spending signal: A national panel found a 1% increase in school spending correlates with roughly a 0.95% rise in house prices, driven mostly by teacher salaries.
Hot markets and weak-capitalization markets tell very different stories. In tight coastal metros with strict zoning and few buildable lots, school quality gets baked hard into price because buyers can’t just build their way into a good district. Compare that to fast-growing Sun Belt metros with abundant new construction and looser district boundaries: builders can add supply near good schools quickly, and open-enrollment policies mean a family isn’t locked to one address. Capitalization in those markets tends to run closer to the low single digits, sometimes near zero.
How School Quality Actually Gets Baked Into Price
School ratings don’t move home prices by magic. Three separate channels do the work, and understanding them helps you tell a real premium from a temporary bidding frenzy.
- Demand channels. Families with school-age kids actively pay more to access a specific attendance zone, and that demand compounds through peer effects: parents believe (rightly or wrongly) that a concentration of engaged families and well-funded classrooms produces better outcomes for their own kids.
- Supply and market channels. Strong districts trigger bidding wars, shrink time on market, and pull developers toward adjacent land. One analysis of redistricting events found that boundary changes accelerate both price appreciation and new construction almost immediately after a district reassignment is announced.
- Signal channels. Test scores, per-pupil spending, and report cards act as proxies for a school’s future trajectory. NBER research shows teacher salary spending specifically gets capitalized into home prices, since parents read staffing investment as a leading indicator of quality, not just a budget line.
The tricky part for researchers, and for you, is separating a school’s actual effect from everything else that happens to cluster with good schools: safer streets, newer housing stock, higher-income neighbors. Economists call this endogeneity, and it’s the reason a simple price comparison across two random zip codes overstates the school effect. The more credible studies use boundary discontinuity designs (comparing homes just inside versus just outside an attendance line) or repeat-sales models that track the same house before and after a redistricting event, which strips out most of the neighborhood noise.
Pro Tip: When you see a listing agent tout “top-rated schools,” ask which measure they mean. A district with high average test scores but flat year-over-year growth signals something very different from one with rising value-added scores, and only one of those is likely to keep commanding a premium five years from now.
What Premium Should You Actually Expect By School Rating?
Translating national research into a number you can use at the negotiating table means separating the school-rating band from the proximity effect, since both move price independently.
| School-Performance Band | Typical Price Premium | What Drives It |
|---|---|---|
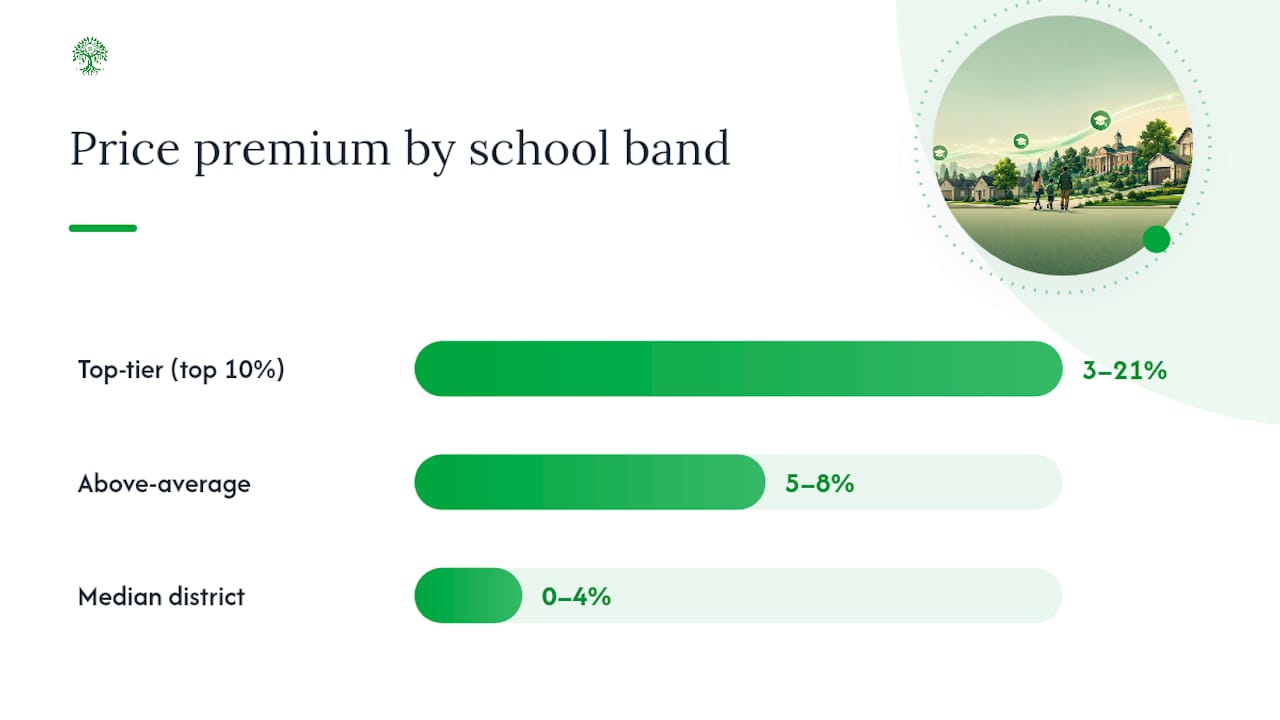
| Top-tier (top 10% statewide) | 3% to 21% | High test-score concentration, strong staffing budgets, heavy buyer competition |
| Above-average | 5% to 8% | Moderate demand premium, some peer-effect signaling |
| Median district | 0% to 4% | Limited differentiation from adjacent zones |
| Below-average | Neutral to negative | Weaker demand, longer time on market, price concessions common |
These bands come from a range of studies using different methods, so treat them as directional rather than exact. A 2019 meta-analysis of school-quality capitalization found no single dominant measure of school quality across studies. Some papers weight test scores, others weight spending or growth metrics, and regional housing-market conditions swing the results as much as the school variable itself.
Proximity adds a second, separate layer on top of the rating band. Elementary school distance carries the heavier penalty, roughly 7.29% per kilometer, because parents of younger kids prioritize walkability and short drop-off routes. High school distance matters less, at around 1.43% per kilometer, since older students often bus in or drive themselves. There’s a nuance worth knowing here too: living directly adjacent to a school, within a few hundred feet, can actually work against you. Traffic congestion during drop-off and pickup, plus playground noise, sometimes creates a small nuisance discount that offsets part of the proximity premium.
Regional variation is significant. A Memphis-area case study found that a one-standard-deviation increase in test scores lifted home prices by 2% to 4%, while the effect of district administration and control alone added another 5% to 8% in some neighborhoods, suggesting governance and local funding decisions carry weight independent of test scores. Markets with widespread school-choice or open-enrollment policies show weaker capitalization overall, since a family isn’t tied to one specific address to access a specific school.
To apply national ranges locally, start with the band that matches the district’s rating, then adjust up or down based on your metro’s supply constraints. A supply-starved coastal market pushes toward the top of each range; a fast-building Sun Belt suburb with flexible enrollment pushes toward the bottom.
A Step-by-Step Way to Price School Quality Into Your Offer
Here’s how to move from “this district looks good” to an actual number you can defend in a negotiation.
- Verify the attendance boundary before you fall for the listing. Boundaries shift, and a home advertised as “zoned for” a top school might sit one street outside the actual line. Pull the boundary map directly from the district’s website, not from a listing description.
- Identify which quality measure is driving the reputation. A district known for high test scores isn’t automatically the same as one with strong value-added growth or high per-pupil spending. One notable finding: when Los Angeles publicly released value-added teacher ratings, property values barely moved, suggesting the market responds more to simple, visible markers like test-score levels than to complex statistical measures.
- Check enrollment against capacity. An overcrowded, popular school can mean portables, waitlists, or future boundary redraws, any of which can undercut the very premium you’re paying for.
- Estimate the premium and adjust your offer math. If comparable sales outside the boundary run 8% cheaper than nearly identical homes inside it, that gap is your working premium. Weigh it against your monthly budget the same way you’d weigh any other true cost of ownership.
- Factor in resale liquidity, not just entry price. Homes in strong districts tend to sell faster and attract more competing offers when you eventually list, which matters if you expect to move within five to seven years.
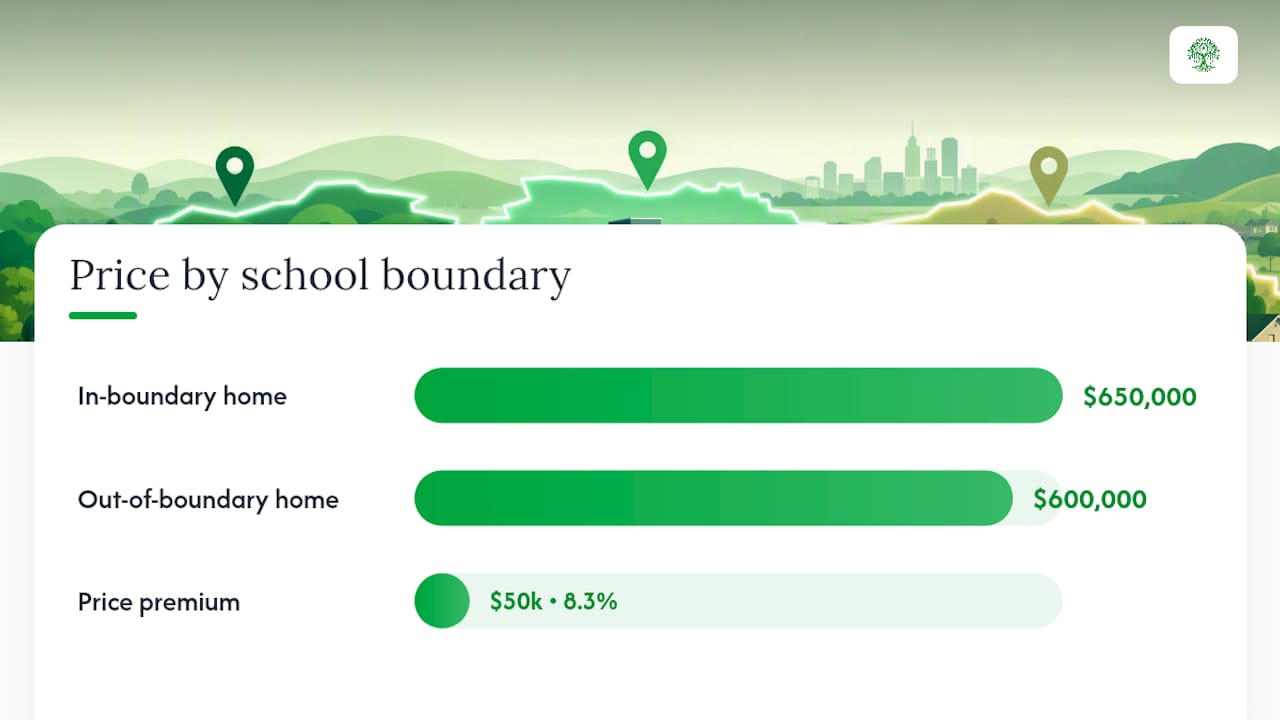
Here’s a simplified version of the math. Say two nearly identical three-bedroom homes sit half a mile apart, one inside a top-tier elementary boundary and one just outside it. The in-boundary home lists at $650,000; the comparable out-of-boundary home sold last month for $600,000. That’s an 8.3% premium, roughly $50,000. If your investment horizon is short and rental yield matters more to you than school access, that $50,000 might buy you a better cap rate elsewhere. If you’re a long-hold family buyer prioritizing resale demand and stability, the premium often pays for itself through faster appreciation and a shorter time on market when you sell.
That’s the real trade-off every buyer faces: pay for documented stability now, or bet on appreciation potential in a less-established but improving area. Neither choice is wrong, but only one of them is backed by a verified boundary line.
Pro Tip: Look for homes that recently sold on both sides of a school boundary within the same few months. That pair gives you a market-implied, neighborhood-specific premium without needing to run a regression, since it strips out almost every variable except the school assignment itself.
Which Studies Should You Actually Trust?
Not all school-price research is created equal, and the design behind a study matters as much as its headline number.
- Boundary discontinuity designs compare homes on opposite sides of an attendance line that are otherwise nearly identical in age, size, and neighborhood amenities. This is considered one of the more credible approaches because it isolates the school variable from the neighborhood noise that inflates simpler comparisons.
- Repeat-sales models track the same property’s price before and after a boundary change or school-quality shift, controlling for anything fixed about the house itself.
- School finance reform studies exploit sudden, externally imposed changes in spending, letting researchers estimate how much of a price shift comes specifically from the dollars, not from reputation or demographics shifting at the same time.
A few landmark findings define the outer bounds of what’s credible. The NBER working paper on school spending capitalization puts the elasticity at roughly 0.95%, meaning a 1% jump in spending tracks closely with a nearly proportional rise in home prices, concentrated in salary spending rather than facilities or supplies. On the higher end, the 2025 study on schools as housing amenities documents premiums stretching to 21% in select markets.
Cross-sectional comparisons, the simplest and most common type of analysis you’ll see quoted in real estate marketing, tend to overstate the true school effect because they can’t fully separate school quality from correlated neighborhood advantages. Research on selection and capitalization suggests these simpler comparisons can inflate the real effect by several multiples compared to causal designs, which is exactly why a realtor’s claim of a “20% school premium” deserves a second look before you accept it at face value. When you’re evaluating aggregated real estate data, always ask whether the school-value claim behind it comes from a causal design or a raw average.
How We Read School-Price Data When Advising Buyers
Three heuristics guide how we think about school capitalization in practice. First, prioritize premiums confirmed by an actual attendance boundary over ones implied by neighborhood reputation, since boundaries are the one variable a district can redraw overnight. Second, always stress-test a premium against resale liquidity, not just entry price. Third, weigh local school-choice policy heavily. In open-enrollment districts, the tight link between address and school access weakens, and so does the price effect. Running these checks by hand takes real research time; an AI-powered platform can pull boundary data and comparable sales side by side in minutes, which is exactly the kind of grunt work worth automating.
Let Ficustree Check the School Premium Before You Bid
Verifying an attendance boundary, comparing capitalization measures, and modeling a premium against resale liquidity is exactly the kind of desk work that eats a weekend when you’re doing it manually across five neighborhoods. Ficustree’s AI-powered home search runs those checks in the background as you browse listings, surfacing boundary lines and comparable sales so you’re not guessing whether a “top school” claim actually holds up address by address.

As a buyer-side platform, Ficustree represents you directly for a flat $1,000 fee at closing plus 1% commission, with a rebate where state law allows it, so the incentive to help you avoid overpaying for a school zone sits on your side of the table, not the listing agent’s. If a mini-calculation like the one above raised more questions than it answered, that’s a normal reaction. Visit the Ficustree buyer page to see how the platform pairs school-boundary data with affordability tools built for exactly this kind of trade-off, and book an on-demand showing agent for the homes where the numbers actually line up.
Where to Verify School and Boundary Data Yourself
Trusting a number in an article is fine for context; trusting it for a six-figure decision is not. Pull the primary data yourself.
- National Center for Education Statistics (NCES) hosts test-score trends, staffing ratios, and district-level report cards used by most academic studies cited here.
- State education department portals publish the underlying school report cards behind most third-party rating sites.
- District websites hold the actual attendance boundary maps, which are the most reliable and current source for confirming exactly which school a specific address feeds into.
This article is general information, not a substitute for advice from a qualified financial advisor. Consult a qualified financial professional about your own circumstances before acting on anything here.
Sources
- Persistence and variation of schools as housing amenities (2025)
- House prices and local spending on public-school teachers (NBER Digest)
- Effect of distance to schooling on home prices
- A Meta‑Analysis of School Quality Capitalization in U.S. House Prices (2019)
- The capitalization of school spending into house prices (NBER working paper w28255)
FAQ
Does school district affect home value?
Yes. Homes zoned to higher-performing schools typically sell for a premium of 3% to 21% over comparable homes in weaker districts, with the size of the effect depending on local market conditions and how school quality is measured.
What decreases property value the most?
Beyond school quality, the biggest drags on property value tend to be deferred maintenance, proximity to industrial or high-traffic zones, and being zoned to a declining or overcrowded school district, since buyer demand and financing options both shrink for homes with these issues.
What is the 3-3-3 rule in real estate?
The 3-3-3 rule is a budgeting guideline suggesting buyers spend no more than 3 times their annual income on a home, keep housing costs under 3 weeks’ worth of savings for the down payment threshold as a benchmark, and hold a 3-month emergency fund after closing. It’s a rough affordability check, not a school-related metric.
Does living next to a school increase property value?
Being close to a school generally raises value, since proximity effects run as high as 7.29% per kilometer for elementary schools. Living directly adjacent, within a few hundred feet, can slightly offset that gain due to drop-off traffic and noise.
How can I estimate a school premium for a specific neighborhood?
Compare recent sale prices of similar homes on both sides of the same attendance boundary. That pairing isolates the school variable from most other neighborhood factors, and tools like Ficustree’s property search can help surface those comparable sales quickly.
Recommended
- Why Are Home Prices So High in California? – ficustree.ai
- Home Inspection Secrets Every Buyer Should Know
- Home – AI-Powered Real Estate Search
- Home – AI-Powered Real Estate Search

Leave a Reply